
Read this first: six things parents can take away
A school board’s name, school fees or a single test score cannot tell a family everything about the learning opportunities available to a child. This paper asks what publicly available evidence can reveal—and what it cannot. [S1] [S2] [S3] [S4] [S5]
1 | Basic arithmetic improved in rural India
In ASER, Grade 3 subtraction rose from 25.9% (2022) to 33.7% (2024); Grade 5 division rose from 25.6% to 30.7%. A positive trend, but many surveyed children still did not demonstrate these tasks. [S2]
2 | Specific maths concepts deserve closer attention
PARAKH reported 29% correct for Grade 6 fractions and 28% for Grade 9 percentage applications. All 35 reviewed full State/UT reports had below-50% scores on those selected measures. [S1] [A1]
3 | State scores vary, but are not a school-quality league table
PARAKH offers 36-jurisdiction subject snapshots. It does not link individual children across grades, provide public uncertainty for every comparison, or establish that a board or teacher policy caused the differences. [S1] [A1]
4 | Learning support and inclusion cannot be presumed from enrolment
PARAKH questionnaire responses report 38% of schools having trained/certified staff for children with special needs; 35% offering special accommodations. These reflect reported conditions, not verified child-level entitlements. [S1]
5 | Household education spending is an additional lens
MoSPI reports much higher average household school-education expenditure in non-government schools. That is a cost difference—not evidence that ₹1.5–3 lakh schools deliver better learning than ₹60,000 schools or government schools. [S4]
6 | Private-school price tiers are not yet linked to measured outcomes
Our audited sources separate school-management categories, but do not reliably link fees of ₹60,000 versus ₹1.5–3 lakh to like-for-like learning outcomes. That comparison is an identified research gap, not a completed quality verdict. [S1] [S4] [A2]
What this paper helps you do
Ask schools more specific questions about competencies, learning support and follow-up assessments.
Understand the differences between trends over time and State/UT snapshots at one point in time.
Recognise where evidence is insufficient before making expensive education decisions.
1 Why this research exists
AltX Research Working Paper 01 investigated whether published evidence proves that one Class XII board produces more IIT or NEET successes than another. Its finding was narrower: reviewed public sources did not provide the linked board-by-background-by-examination funnel needed to isolate that association. [S6]
Working Paper 02 turns to the years before those examinations. It examines measured learning, access, school circumstances and family costs. Its ambition is public understanding: make sophisticated public data readable without turning their limitations into certainty. The subject is Indian K-12 Education, but the current learning datasets measure specified grades and populations—not every year from kindergarten through Grade 12.
Research objective: (1) identify comparable learning trends, (2) explain state-wise variation, (3) assess what school-management comparisons show, and (4) investigate the relationship between fees and educational delivery. We write primarily for parents, but publish sufficient definitions and sources for schools, institutions and researchers to scrutinise the same claims.
Out of scope: evaluating tutoring or test-preparation businesses. Where students also receive outside help, later results cannot be attributed to the school alone. Neither school-board affiliation nor management type is a substitute for a direct measure of learning.
Who is this for?
| Audience | Practical use |
|---|---|
| Parents and caregivers | Recognise what published scores do—and do not—mean; ask schools better questions. |
| School leaders and teachers | Look beyond total marks to specific competencies; evaluate support with local evidence. |
| Education departments | Publish interpretable indicators with denominators, uncertainty and follow-up evidence. |
| Researchers and journalists | Reuse the source trail and contest assumptions without losing statistical context. |
2 How to read education data
| Data type | Meaning | Example |
|---|---|---|
| Trend | A comparable measure observed in more than one period. | ASER rural Grade 3 subtraction, 2018 / 2022 / 2024 |
| Snapshot | What a specific assessment reports for a specific year. | PARAKH Grade 6 mathematics, 2024 |
| Input | A resource or condition—not a learning outcome. | UDISE+ pupil–teacher ratio |
| Household cost | Money spent by surveyed households, not education value added. | CMS expenditure / coaching |
| Evidence gap | A desired comparison that the reviewed datasets cannot directly support. | Class XII board × coaching × admission |
3 The national trend: recovery in basic rural arithmetic
SOURCE: ASER 2024 NATIONAL FINDINGS, PP. 46–48 [S2]
ASER visits households in rural India and assesses sampled children one-on-one on basic tasks. The approach is sufficiently consistent across survey rounds for the source to report change over time; it is not a longitudinal study of the same children.
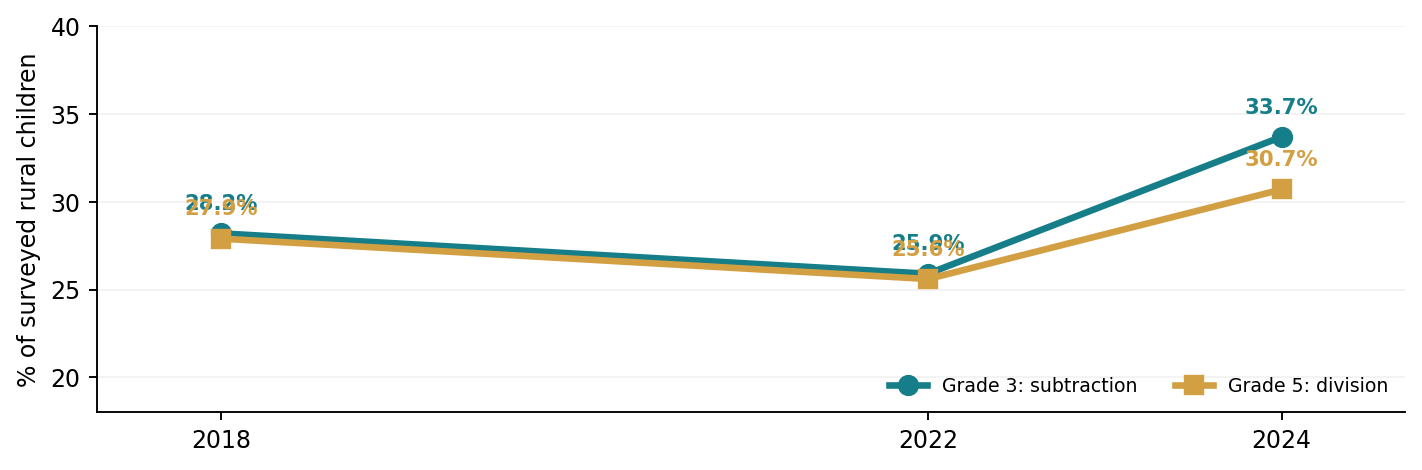
Share of surveyed rural children meeting each indicated ASER task threshold; not the same construct as PARAKH percentage-correct scores.
From 2022 to 2024, the Grade 3 subtraction measure increased by 7.8 percentage points, and the Grade 5 division measure by 5.1 points. The 2024 levels remain below half of surveyed children for both indicated tasks. These facts can coexist: improvement does not mean that the challenge has disappeared. [S2]
What a parent can take from this
Ask whether a school checks children’s understanding of foundational operations, not only whether the textbook chapter was completed. Request examples of how learning difficulties are identified and revisited. This suggestion follows from the measured skills; it is not an experimentally proven intervention.
What would be a misleading conclusion?
“All Indian schools improved between 2022 and 2024” would overstate the evidence. ASER is a rural survey and the two indicators refer to different elementary grades. State, school-management and subgroup patterns also vary.
4 The national snapshot: concepts behind overall maths scores
SOURCE: PARAKH RASHTRIYA SARVEKSHAN 2024 [S1]
PARAKH assessed Grades 3, 6 and 9 in sampled schools. It reports overall subject scores and selected competency-level averages. The national mathematics subject scores are 60% in Grade 3, 46% in Grade 6 and 37% in Grade 9. These are different grades, different students and different assessed content—not a measure of students losing ability over time. [S1]
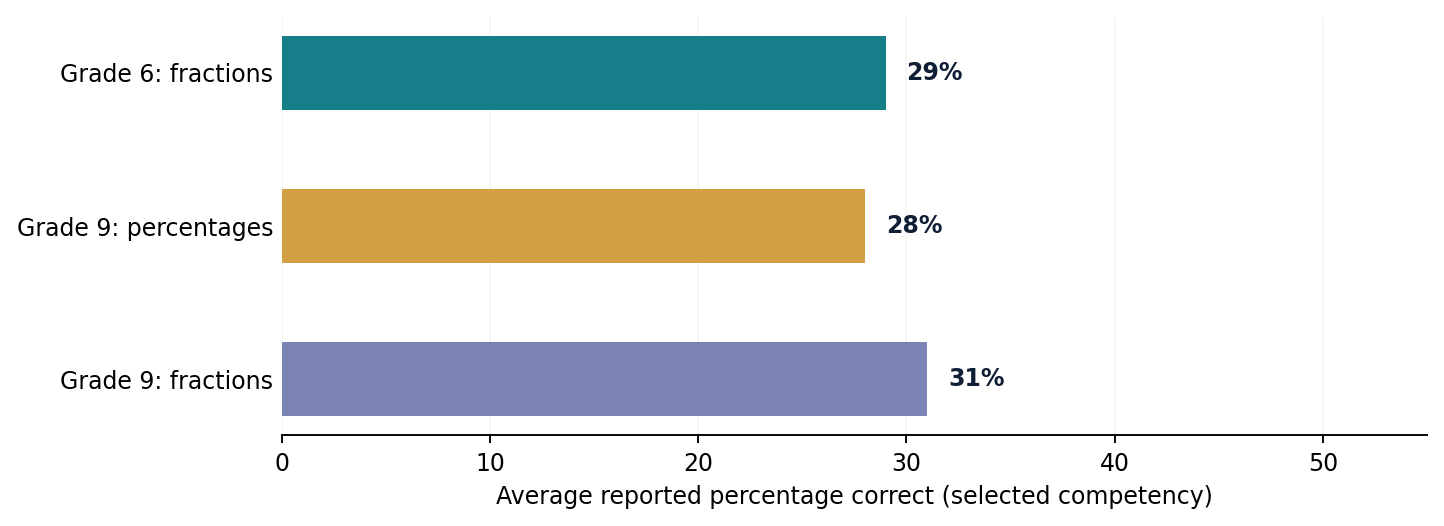
National average percentage correct on selected PARAKH competency questions; not individual pass/fail rates or mastery percentages. [S1]
Across 35 complete State/UT reports reviewed by AltX Research, Grade 6 fractions, Grade 9 applying percentages and Grade 9 fractions in everyday contexts all had published scores below 50%. Chandigarh’s full competency report was not available; its aggregate subject scores were checked separately against its district report. [A1]
Why this is useful
A subject average may obscure specific assessed concepts. Seven jurisdictions had an overall Grade 6 mathematics score of at least 50%, yet their selected fractions score was below 50%. The two measures use different questions: this contrast is a screening signal, not proof of a particular instructional failure. [A1]
What parents can ask
“How does the school check whether students understand fractions and percentages in everyday situations? How are misconceptions identified, and how does the school tell parents whether follow-up support helped?”
5 State-wise evidence: patterns without false rankings
PARAKH gives a 2024 learning snapshot for all 28 states and 8 Union Territories. The appendix shows three mathematics subject measures for every jurisdiction alongside an administrative staffing indicator. It is a reference table, not a league table. [A1] [S3]
State trends where the source actually permits them
ASER separately reports that, between 2022 and 2024, Grade 3 subtraction among rural government-school pupils rose by more than 15 percentage points in Tamil Nadu and Himachal Pradesh; Grade 5 division rose by more than 10 points in Punjab and Uttarakhand. These statements are specific to ASER skills, populations and years, not all schooling or board categories. [S2]
Examples of why local context matters
| State / UT | G3 maths | G6 maths | G9 maths | Primary PTR |
|---|---|---|---|---|
| Punjab | 78% | 62% | 52% | 20:1 |
| Kerala | 70% | 60% | 45% | 22:1 |
| Tamil Nadu | 55% | 40% | 32% | 20:1 |
| Bihar | 54% | 45% | 39% | 26:1 |
| Meghalaya | 53% | 34% | 29% | 18:1 |
| Chandigarh | 60% | 54% | 43% | 22:1 |
PARAKH 2024: grade-specific reported mean percentage scores. UDISE+ 2024–25: primary-stage aggregate pupil–teacher ratio. The two datasets do not describe the same pupils. [A1] [S3]
The differences are real as reported point estimates. But we do not have adequate independently validated State/UT standard errors to claim statistically significant superiority, nor individual-level data to attribute the variation to a school board, school fees, coaching or teacher quality.
A safer way to read your state
Read each grade and subject separately; do not subtract Grade 9 scores from Grade 3 scores to describe “learning loss”.
Use national benchmarks as context, not as a pass/fail boundary for the state.
Investigate the distribution within your state: district, school management, location and student backgrounds may matter.
Use state reports to identify questions; ask individual schools for their own credible learning and support evidence.
What the newly audited trends reveal
The published PARAKH 2024 state/UT subject tables show Grade 3 mathematics percentage-correct scores above Grade 6, and Grade 6 above Grade 9, in 36 of 36 jurisdictions. This is an ordering across different cohorts and grade-specific instruments—not evidence that pupils become less capable as they progress. Only 18 of the 36 jurisdictions show the same strictly descending reported pattern for Language. [A2]
More useful time-based comparisons come from ASER’s repeated rural government-school samples. Among 27 audited jurisdiction profiles, Grade 3 reading attainment was higher in 2024 than in 2022 in 26; Grade 3 subtraction was higher in 22; and Grade 5 division was higher in 25. However, 2024 Grade 3 reading remained below its 2018 reported value in 14 of 27. These are unweighted counts of jurisdictions, not counts of children or significance-tested changes. [A2] [S7]
| What changed in rural government schools? | Jurisdictions with higher 2024 than 2022 value | Important context |
|---|---|---|
| Grade 3 reading Grade 2 text | 26 of 27 | Repeated rural samples; same ASER task |
| Grade 3 able to subtract | 22 of 27 | Five had lower reported point estimates |
| Grade 5 able to divide | 25 of 27 | Not the same cohort as Grade 3 |
| Grade 3 reading vs 2018 | 13 of 27 above 2018 | 14 remained below 2018 despite widespread recovery |
For parents: ask whether local schools can demonstrate progress in a consistent skill over time. For education authorities: report the dates, denominators and uncertainty behind a change. A national average cannot describe the path of every state, district or school. [A2] [S7]
6 What school resources and inclusion data reveal
SOURCES: UDISE+ 2024–25 AND PARAKH 2024 [S1] [S3]
A low pupil–teacher ratio describes reported teacher availability relative to enrolment across an administrative category. It cannot tell parents whether their child has a subject specialist, a manageable classroom, effective teaching or consistent support.
PARAKH’s school-context and pupil questionnaires add different information. Its national report includes the following reported inclusion measures:
| Reported figure | Exact measure (different respondent bases) |
|---|---|
| 38% | Schools reporting trained/certified teachers to support children with special needs |
| 35% | Schools reporting special accommodations for children with special needs |
| 34% | Children with special needs reporting access to assistive devices at school |
National PARAKH Report, printed p.33. These are distinct school- and student-level self-reports; do not add them, average them, or interpret them as the same denominator. [S1]
The figures raise an actionable accountability question: does an institution merely report a policy or resource, or can it demonstrate that a learner who needs support receives it? But the survey alone cannot establish whether any particular school is compliant or what an individual child experienced.
What parents and institutions can request
A documented process for requesting learning accommodations, with privacy protections.
Evidence that specialist support is available and delivered where needed, rather than a general statement of inclusion.
Feedback on whether support plans are reviewed and revised after assessment.
7 The price of schooling: cost, school management and educational delivery
SOURCE: MoSPI CMS: EDUCATION 2025 [S4]
A nationally sampled household expenditure survey offers a separate view of the financial demands of schooling. It measures household spending by management category, not teaching quality or individual academic gain.
| School category | Mean expenditure | Population | What this does not measure |
|---|---|---|---|
| Government schools | ₹2,863 | Per enrolled student, all India | Not public expenditure per pupil or quality |
| Non-government schools | ₹25,002 | Per enrolled student, all India | Not tuition fee tier or educational value added |
CMS Education 2025; annual household school-education expenditure per enrolled student. These amounts do not measure institutional costs, tuition fee bands or learning quality. [S4]
The survey reports average household expenditure on school education of ₹2,863 per enrolled student in government schools and ₹25,002 in non-government schools. These are school-education expenditures, not tuition-fee quotes, total public expenditure per pupil, or measures of school value added. The populations differ. [S4]
What this means for parents
Price can determine which school a household can access, but price alone is not proof of stronger educational delivery. Ask for annual tuition, mandatory extras, grade-specific costs, learning evidence and student support. Optional external coaching is not a school-delivery indicator in this study.
Why we do not rank states on expenditure
MoSPI explicitly warns that subnational estimates require attention to domain sample size and relative standard error. We therefore exclude precise state expense rankings from this version rather than publish spurious differences. [S4]
7.1 National outcomes by school management
PARAKH includes state-government, government-aided, private-recognised and central-government schools. The national mathematics figures below are mean percentage-correct results for grade-specific assessments. They do not represent comparable fee groups, and student selection and background may differ across school-management populations. [S1] [A2]
| Assessment | State-government schools | Private-recognised schools | Private − government |
|---|---|---|---|
| Grade 3 mathematics | 61% | 60% | −1 pp |
| Grade 6 mathematics | 43% | 49% | +6 pp |
| Grade 9 mathematics | 33% | 39% | +6 pp |
The differences vary by grade. The Grade 3 result is close, while the later-grade private-school point estimates are higher. This is a descriptive comparison of different enrolled populations, not proof that private schools cause higher scores or provide better value per rupee. We retain government-aided and central-government categories in the evidence workbook rather than folding them into either column. [S1] [A2]
7.2 Repeated rural surveys, not student tracking
ASER does not follow the same child; it repeats comparable basic-skill tasks on new rural household samples. Its national Grade 3 reading series shows a larger 2022–2024 rise in government schools than private schools, although the latter group still has a higher 2024 reported attainment percentage. No causal inference follows from these trends. [S7] [A2]
| Grade 3 rural reading: Std II-level text | 2018 | 2022 | 2024 | 2022–24 change |
|---|---|---|---|---|
| Government schools | 20.9% | 16.3% | 23.4% | +7.1 pp |
| Private schools | 40.6% | 33.1% | 35.5% | +2.4 pp |
The narrower private-government reading gap in this task reflects changes in reported attainment, not measured school value added. State-wise private-school multi-year outcomes beyond the verified examples have not yet been fully audited; we do not generalise from incomplete coverage. [S7] [A2]
7.3 The fee tiers parents actually compare
A ₹60,000 school and a ₹3 lakh school do not occupy different categories in PARAKH or the MoSPI school-management averages. The fee bands below are an AltX proposed research design—not an already observed national dataset and not a validated classification of quality.
| School segment to study | Annual tuition band | Current evidence status |
|---|---|---|
| Government / publicly funded | Usually low household tuition; families may still incur other costs | National spending and learning data; not directly matched |
| Lower-fee private | Up to ₹60,000 | No verified fee-to-learning linkage |
| Mid-fee private | Above ₹60,000, below ₹1.5 lakh | No verified fee-to-learning linkage |
| Premium private (non-ultra-premium) | ₹1.5 lakh to ₹3 lakh | No verified fee-to-learning linkage |
The survey’s ₹2,863 and ₹25,002 averages describe average household school expenditure by broad management type, not the tuition fees of these segments. It would be misleading to calculate a “quality per rupee” statistic from unmatched national cost and test-score averages. [S4]
7.4 How we propose to measure educational delivery fairly
| Dimension | Evidence to request | Comparison safeguards |
|---|---|---|
| Learning | Independent age/grade-matched skill assessments; repeated school results | Equivalent tests, baseline attainment, sample size |
| Progression | Retention, transitions, attendance and completion | Cohort denominators and missing pupils |
| Teaching and support | Subject staffing, training, support plans, inclusion | School-level delivery, not only state PTR |
| Family price | Published grade-wise fee schedules and mandatory extras | Same year, grade and geography; separate fee from household cost |
| Accountability | Source documentation, revisions and accessible parent reporting | Privacy protections; no selective topper-only outcomes |
A fair comparison would stratify by state or district, locality, grade, school size, management, household circumstances, prior attainment and other relevant selection factors where lawful and observable. It should report unknowns. School affiliation (CBSE/CISCE/state board) must be recorded separately from management and tuition category.
7.5 What remains outside this paper
Private tuition centres and coaching institutions are not evaluated or compared. Nonetheless, if senior students receive external preparation, examination outcomes cannot be treated as school-only results. We will not attribute JEE/NEET qualifications or IIT/medical admissions to fee tiers without linked, responsibly collected records. Working Paper 01 documents that data gap. [S6]
Interim research conclusion: publicly available sources confirm both learning differences by management category and large differences in household school expenditure. They do not yet demonstrate whether paying ₹1.5–3 lakh produces more learning than paying ₹60,000 or attending a government school. Resolving this is a next-stage evidence task, not a finding to manufacture. [S1] [S4] [A2]
8 Educational pathways: what can and cannot be credited to schools
Working Paper 01 found that the public sources it reviewed did not provide enough linked information to isolate the association between Class XII certifying board, student background, coaching and NEET/JEE admission outcomes. This remains a disclosure and research-design issue, not proof that boards make no difference. [S6]
What data would allow a fairer comparison?
| Layer | Minimum disclosure requirement |
|---|---|
| School experience | Class XII certifying board, school management, medium, location, relevant attainment |
| Access factors | Household resources, coaching exposure, disability accommodation where collected and lawful |
| Exam funnel | Eligible cohort → applicants → appeared → qualified → counselling → offers → admissions |
| Statistical protection | Clear denominators, unknown categories, minimum cell sizes, privacy-suppressions and metadata |
A public table by board alone would be useful for transparency but insufficient to explain differences. We recommend staged, privacy-conscious disclosure, first establishing what records institutions already hold and their legal ability to share them.
The question we cannot answer yet
“Does one board produce better exam outcomes, once household circumstances, coaching and prior learning are considered?” We cannot currently answer that causal question from these reviewed sources. [S6]
9 Looking ahead to 2027–2029: three plausible scenarios
A forecast should make clear what is projected, which data support it and how uncertain it is. PARAKH provides one 2024 cycle, ASER offers repeated rural measures, and UDISE+ measures administrative conditions. That is not enough to forecast each state’s 2027 learning score responsibly. The following are conditional scenarios—not measured probabilities or numerical forecasts.
| Scenario | What it means | What would test it |
|---|---|---|
| Continued recovery | If foundational support and follow-up persist, ASER-style basic skills could continue improving. | Watch future ASER task rates, by state and school-management group. |
| Uneven progress | Overall subject measures might improve while selected fractions and percentage competencies remain relatively low. | Watch repeat PARAKH competency measures and whether tests are comparable. |
| Resources without learning gains | Staffing/infrastructure reporting might improve without corresponding gains in measured learning. | Watch paired indicators with compatible definitions and suitable uncertainty. |
What would change our assessment?
A new assessment using demonstrably comparable items and properly reported confidence intervals.
State/UT skill trends with adequate samples, consistent scoring and defined cohorts.
Access to school-level practice evidence and representative, ethically collected household context.
We will not predict “which state will win” or how much a board will improve NEET selection. Those claims require data and models not contained in the present source set.
10 Eleven questions parents can ask schools
Use these questions as conversation starters. A school should be able to explain its own policies, evidence and next steps. National averages cannot substitute for local information.
01 What does learning evidence show beyond examination marks?
Look for: Examples of concept-level diagnostics; measurement dates; careful interpretation.
02 How do teachers identify misunderstanding in fractions, percentage and applied arithmetic?
Look for: Age-appropriate tasks and an explanation of follow-up support.
03 How will I know whether my child is improving?
Look for: An agreed review point and understandable feedback, not an unsupported guarantee.
04 What support is available for a student who needs accommodations?
Look for: A clear request process, responsible contact, and documented adjustments.
05 Do teachers have time and relevant preparation for the subjects they teach?
Look for: Actual staffing and specialist coverage, not just an overall PTR.
06 What is the complete annual cost, including optional extras?
Look for: Written fees and realistic estimates for transport, materials and other costs.
07 What information does the school collect and protect?
Look for: Privacy expectations, parent access and correction procedures.
08 If the school claims board superiority, what comparable evidence supports it?
Look for: Cohort definitions, source links, denominators and alternatives to that interpretation.
09 What educational evidence supports a fee premium?
Look for: Grade-appropriate independent learning evidence, actual student support and documented progress; not only buildings, awards, marketing or selected top examination results.
10 Are the costs being compared on identical terms?
Look for: Tuition, registration, transport, books, compulsory activities, technology and annual increases for the same grade and year. Do not confuse household expenditure with the government’s institutional spending.
11 How representative are advertised academic outcomes?
Look for: Full eligible cohort, number who sat the assessment, number reaching each outcome, and whether any student received additional preparation outside school. We do not evaluate coaching providers in this report.
11 What different institutions can do next
| Audience | Evidence-informed proposal |
|---|---|
| State / district education authorities | Publish coherent stage- and district-wise learning panels with uncertainty; document how evidence informs support. |
| Schools and school leaders | Share accessible concept-level feedback, support pathways, inclusive accommodations and transparent fees. |
| Assessment agencies | Publish metadata, state-level standard errors, item/competency definitions and comparable release history. |
| Examination / admission authorities | Disclose privacy-protected examination funnels with board as a separate field from school management. |
| Researchers / media | Separate score, proficiency, rate, cost, association and causal explanations; publish corrections transparently. |
These are accountability proposals, not evaluated policy interventions. Implementation must be adapted to local law, curriculum, capacity and privacy requirements.
12 Boundaries of this report
PARAKH 2024 estimates are rounded published values. We have not independently validated full implemented sampling weights, equating and standard errors.
The 35-jurisdiction competency exercise excludes Chandigarh’s missing full report; its aggregate subject scores were checked separately.
PARAKH Grade 3, Grade 6 and Grade 9 are distinct grade-specific assessments, not a longitudinal series.
ASER covers rural households and uses basic skill tasks that are not equal to PARAKH competency percentage-correct measures.
UDISE+ indicators represent administrative school conditions, not observed teaching practice or causal effects.
CMS Education state estimates are not used for formal state rankings without relevant sample and RSE checks.
No reviewed source set directly establishes independent causal effects of a certifying school board, coaching, spending or teacher deployment on later exam admissions.
The available public sources do not support like-for-like causal school value-added comparisons across tuition fee bands. Proposed fee segments are not an observed national sample; state-specific private-school trend extraction remains incomplete. The study excludes coaching institutions as a subject of comparison, not as a potential confound when interpreting external examination outcomes. Numerical checks reconcile the published appendix to the retained v1.0 evidence matrix; official national tables were cross-checked against NCERT, ASER and MoSPI releases.
Appendix A State/UT maths snapshot, 2024
Use this as a reference—not a ranking. Each grade reports a different assessment. National scores are provided for context; a state’s result is not a prediction for your child. Source panel: AltX Evidence Matrix v1.0, reconciled with NCERT publications; UDISE+ 2024–25. [A1] [S1] [S3]
| Jurisdiction | Grade 3 maths | Grade 6 maths | Grade 9 maths | Primary PTR |
|---|---|---|---|---|
| INDIA | 60 | 46 | 37 | 20 |
| Andaman and Nicobar Islands | 61 | 44 | 35 | 9 |
| Andhra Pradesh | 61 | 41 | 35 | 21 |
| Arunachal Pradesh | 54 | 44 | 34 | 9 |
| Assam | 59 | 45 | 35 | 19 |
| Bihar | 54 | 45 | 39 | 26 |
| Chandigarh | 60 | 54 | 43 | 22 |
| Chhattisgarh | 57 | 42 | 35 | 18 |
| Dadra and Nagar Haveli and Daman and Diu | 62 | 58 | 39 | 28 |
| Delhi | 57 | 47 | 40 | 29 |
| Goa | 51 | 47 | 37 | 23 |
| Gujarat | 52 | 40 | 32 | 24 |
| Haryana | 58 | 45 | 36 | 21 |
| Himachal Pradesh | 72 | 53 | 42 | 13 |
| Jammu and Kashmir | 54 | 39 | 32 | 12 |
| Jharkhand | 51 | 43 | 34 | 26 |
| Karnataka | 57 | 45 | 33 | 21 |
| Kerala | 70 | 60 | 45 | 22 |
| Ladakh | 60 | 45 | 35 | 5 |
| Lakshadweep | 49 | 40 | 33 | 17 |
| Madhya Pradesh | 62 | 48 | 36 | 16 |
| Maharashtra | 64 | 51 | 38 | 24 |
| Manipur | 67 | 48 | 35 | 13 |
| Meghalaya | 53 | 34 | 29 | 18 |
| Mizoram | 59 | 36 | 31 | 12 |
| Nagaland | 57 | 38 | 30 | 9 |
| Odisha | 61 | 51 | 41 | 16 |
| Puducherry | 52 | 40 | 32 | 14 |
| Punjab | 78 | 62 | 52 | 20 |
| Rajasthan | 66 | 53 | 44 | 18 |
| Sikkim | 53 | 43 | 32 | 6 |
| Tamil Nadu | 55 | 40 | 32 | 20 |
| Telangana | 54 | 44 | 36 | 18 |
| Tripura | 52 | 43 | 35 | 16 |
| Uttar Pradesh | 64 | 45 | 34 | 20 |
| Uttarakhand | 55 | 40 | 34 | 15 |
| West Bengal | 53 | 42 | 35 | 21 |
Score columns are published mean percentages. PTR is an aggregate ratio, not class size. Some small differences may fall within unreported sampling uncertainty. “India” is the official national estimate, not the unweighted average of the 36 jurisdictions.
Appendix B Sources and audit provenance
[S1] NCERT/PARAKH (2025), PARAKH Rashtriya Sarvekshan 2024: National Report, pp.1–12, 29, 33, 34.
https://parakh.ncert.gov.in/sites/default/files/2025-07/REPORT_India_IND.pdf
[S2] ASER Centre (2025), ASER 2024: National Findings, pp.46–48.
https://asercentre.org/wp-content/uploads/2022/12/ASER-2024-National-findings.pdf
[S3] Ministry of Education, UDISE+ 2024–25, Existing Structure Report, PTR Tables.
https://dashboard.udiseplus.gov.in/
[S4] MoSPI (2025), CMS: Education, press release 26 August 2025.
https://www.pib.gov.in/PressReleasePage.aspx?PRID=2160863
[S5] NITI Aayog (2026), School Education System in India, source reproduction and cross-check.
https://www.niti.gov.in/sites/default/files/2026-05/School-Education-System-in-India.pdf
[S6] AltX Research (2026), Working Paper 01: Who Gets Through the Gate?, evidence cut-off 9 Nov 2026.
https://altxresearch.org/research
[A1] AltX Research, Evidence Matrix v1.0 (21 Nov 2026), State Matrix, PARAKH Score Recheck, PTR Primary Audit, Numeracy Competency Audit.
Supporting audit retained in research archive; not a public URL until uploaded.
[S7] ASER Centre (2025), ASER 2024: India (Rural), school-management trend tables, pp.52–55, 60–61.
https://asercentre.org/wp-content/uploads/2022/12/India-2.pdf
[A2] AltX Research, State-wise Pattern Audit v1.2, school-management additions (21 Nov 2026).
Working analytical file: AltX_WP02_Statewise_Pattern_Audit_v1_2_School_Types.xlsx; includes 36 PARAKH profiles, 27 ASER government-school state trend profiles, national school-management tables, and explicit pending state-private extraction. File is not yet a public permanent source URL.
Corrections and public accountability
AltX Research welcomes source corrections and relevant original administrative records. Any substantive change will be recorded with its date, revised figures, affected sections and preserved earlier version. Correspondence: kghali@altxresearch.org. Website: https://altxresearch.org/research.